8f2 Worksheets
Functions
Define, evaluate, and compare functions.
2Compare properties of two functions each represented in a different way (algebraically, graphically, numerically in tables, or by verbal descriptions). For example, given a linear function represented by a table of values and a linear function represented by an algebraic expression, determine which function has the greater rate of change.
8f2
8f2


×
Description:
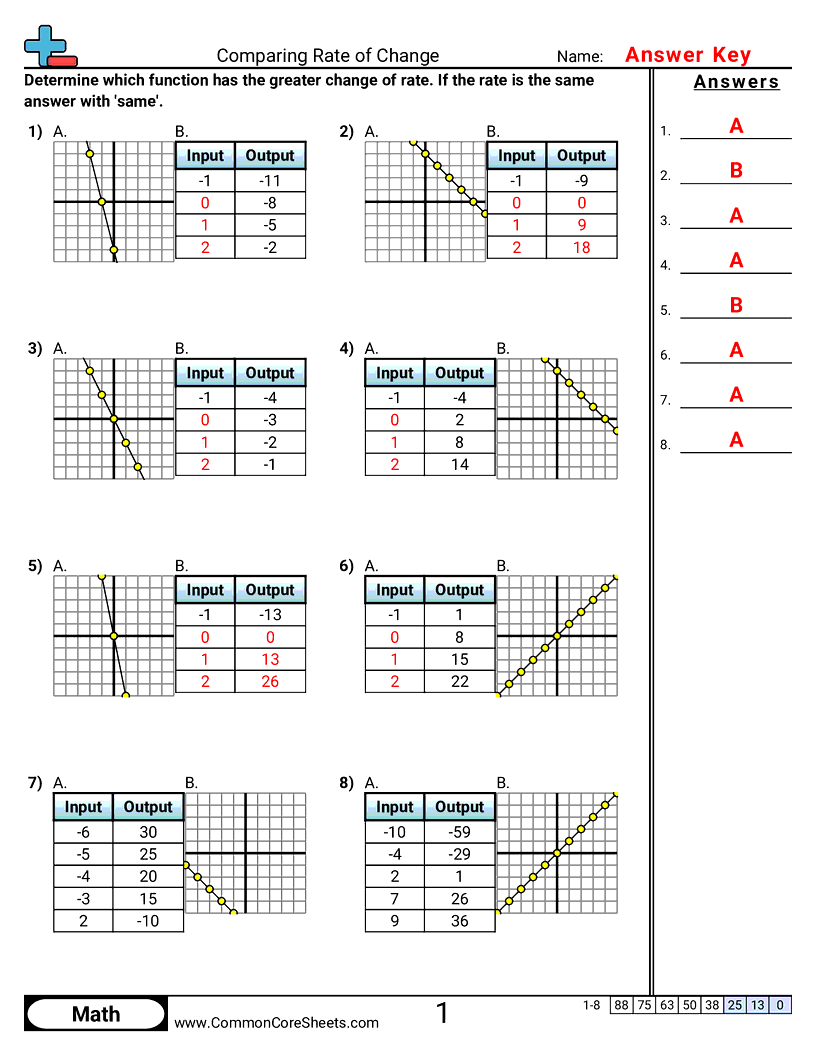
"This worksheet is designed to educate children on the subject of math, specifically the concept of comparing the rate of change. It features eight distinct problems each showcasing different examples and equations of variable 'X' and 'Y'. The worksheet facilitates versatile usage as it can be easily customized, transformed into flashcards, or incorporated into distance learning practices. It is an effective tool for enhancing mathematical understanding whilst promoting interactive learning."

×
Student Goals:
Understanding Mathematical ConceptsUpon successful completion of this worksheet, students should have a greater understanding of the mathematical concept of the rate of change. They will have developed their knowledge of how variabilities in one quantity can impact another, a foundational theme in many branches of mathematics including algebra and calculus.Skill DevelopmentThis exercise aids in the development of mathematical skills such as analytical thinking, problem solving, and numerical proficiency. In solving these problems, students will likely enhance their mental arithmetic abilities, their capacity to apply logical reasoning to real-world scenarios, and their knack for employing mathematical formulas effectively.Ability to Interpret and Solve ProblemsHandling various equations and numerical problems from this worksheet should equip students with the skills needed to interpret and solve mathematical issues efficiently. This worksheet will also precipitate an understanding of how to use mathematical notations and symbols effectively, an important factor in advanced mathematical studies.Confidence and Familiarity with MathematicsAfter completing this worksheet, students should become comfortable with complex mathematical operations and concepts, consequently cultivating an increased confidence in their mathematical abilities. This will encourage a positive attitude towards the subject and reduce math-related anxiety, ultimately improving the overall learning experience.Preparation for Advanced Mathematical StudiesThe rate of change is a critical concept in many advanced mathematical disciplines. By familiarising themselves with this concept through these worksheet exercises, students should be well-prepared for tackling more complex mathematical problems in higher studies. Furthermore, students should be able to establish links between various mathematical concepts, thus adding depth to their understanding of the subject.


8f2


×
Description:
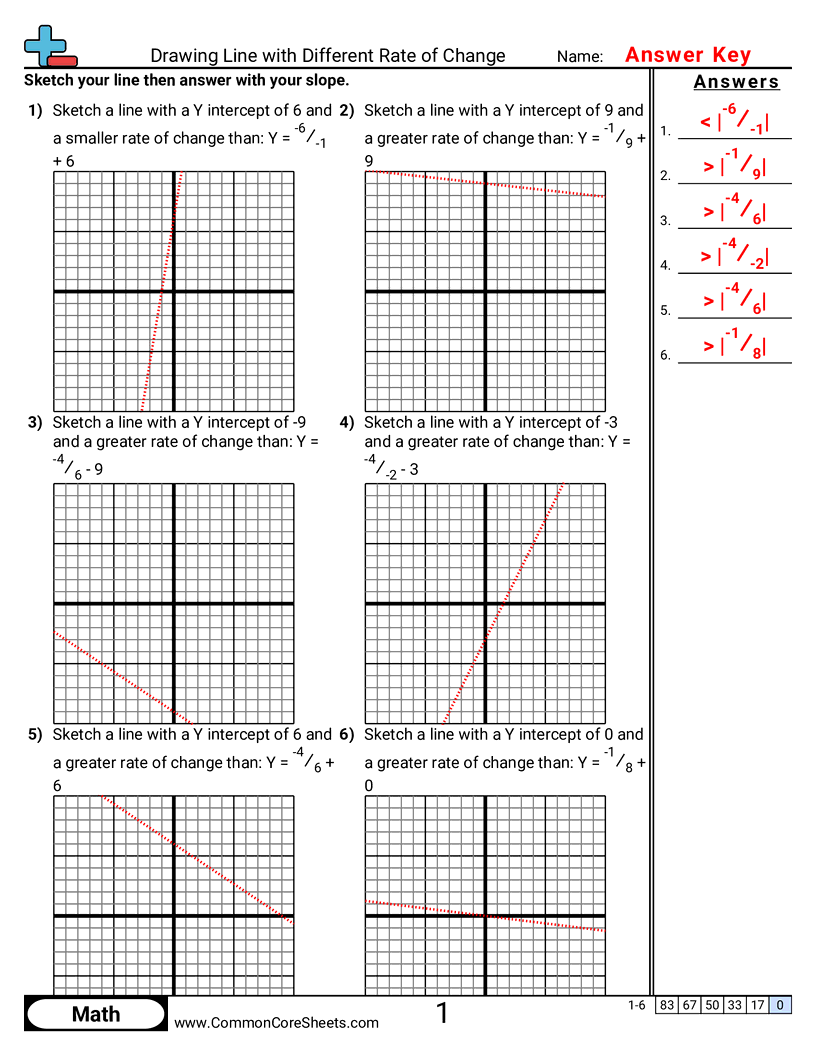
"This worksheet is designed to enhance children's understanding of mathematical concepts like rate of change and y-intercepts. It features six customizable problems that task students with sketching lines with higher or lower rates of change than a given equation. It's an adaptable resource that effortlessly converts into flashcards for easy learning and can also be utilized effectively in distance learning environments."

×
Student Goals:
Understanding of Rate of ChangeAfter completing the worksheet, students should have a stronger understanding of the concept of rate of change in mathematics. They will be able to identify and interpret the rate of change in different mathematical situations, such as in linear equations. This foundational understanding serves as a critical point for future mathematical areas like calculus and physics.Improved Graphing SkillsThis exercise will also allow students to hone their graphing skills. They will develop a greater understanding of how different aspects of an equation, like rate of change and Y-intercept, can impact a graph's representation. This acquired skill is key for visualizing and comprehending various mathematical and scientific concepts.Problem Solving and Critical ReasoningWorking through this worksheet will improve students' problem-solving and critical reasoning skills. They will learn to analyze a mathematical problem, consider its various elements, and determine the most effective approach to finding a solution. These skills are vital for tackling more complex mathematical problems in higher grades, and instrumental beyond the school in real-world decision-making situations.Ability to Compare Mathematical PropertiesStudents will cultivate the ability to compare rates of change. They will practice determining if one line has a greater or smaller rate of change than another, enhancing their comprehension of mathematical comparisons. This understanding can be widely applied in different mathematical situations and is foundational for advanced mathematical topics.Heightened Mathematical Communication SkillsCompleting this exercise will enhance the students' mathematical communication skills. They will learn to describe and explain their process and reasoning both visually through their sketches and potentially verbally or in written format. This ability is central to collaborative work, effective learning, and accurate assessments in the field of Mathematics.Augmented Mathematical ConfidenceLastly, by successfully completing the worksheet, students will boost their confidence in handling math problems. They will gain the assurance that they can understand and solve relatively complex math problems, which is a fundamental aspect of developing a positive attitude and approach towards learning Mathematics.


8f2


×
Description:
"This worksheet is designed to teach children about the rate of change in mathematics, specifically focusing on the relationship between X and Y values and their interceptions. It features 20 customizable problems suitable for distance learning where variables increase or decrease. Can be effortlessly converted into flashcards for enhanced learning experience."

×
Student Goals:
Understanding Rate of ChangeUpon completion of the worksheet, students should have acquired a proficient understanding of the concept of the rate of change in mathematical relationships. They should be able to describe and interpret the rate of change as it relates to the Y-intercept in various scenarios. This foundational knowledge will allow students to better comprehend the relationship between variables in mathematical equations.Problem-solving skillsStudents should also enhance their problem-solving abilities by being able to accurately adjust variables in equations to obtain a desired outcome. This not only strengthens their understanding of the topic but also improves their decision-making and critical thinking skills, both of which are crucial for advanced mathematical computations and real-life applications.Analytical skillsAnother expected accomplishment would be the development of their analytical skills. Given different rates of change, intercept points, and patterns of increases or decreases, students should be able to analyze different mathematical scenarios and determine how changes in one variable can affect the other. This ability requires a certain level of logical reasoning and analytical thinking – skills that are nurtured in the process of learning rate of change.Grasp of Mathematical ConceptsStudents should be able to apply this understanding across different mathematical contexts. The principles understood here are not limited to rate of change problems and can be a stepping stone to comprehend countless other mathematical operations and principles. This worksheet will train students' minds to connect mathematical concepts, which is crucial in higher-level mathematics.Confidence in MathematicsLastly, successful completion of this worksheet should boost students' confidence in selecting strategies for solving math problems and performing mathematical computations. Once they grasp the concept of the rate of change, it can serve as a solid foundation for further mathematical exploration, providing students with the confidence to tackle more difficult problems.


8f2


×
Description:
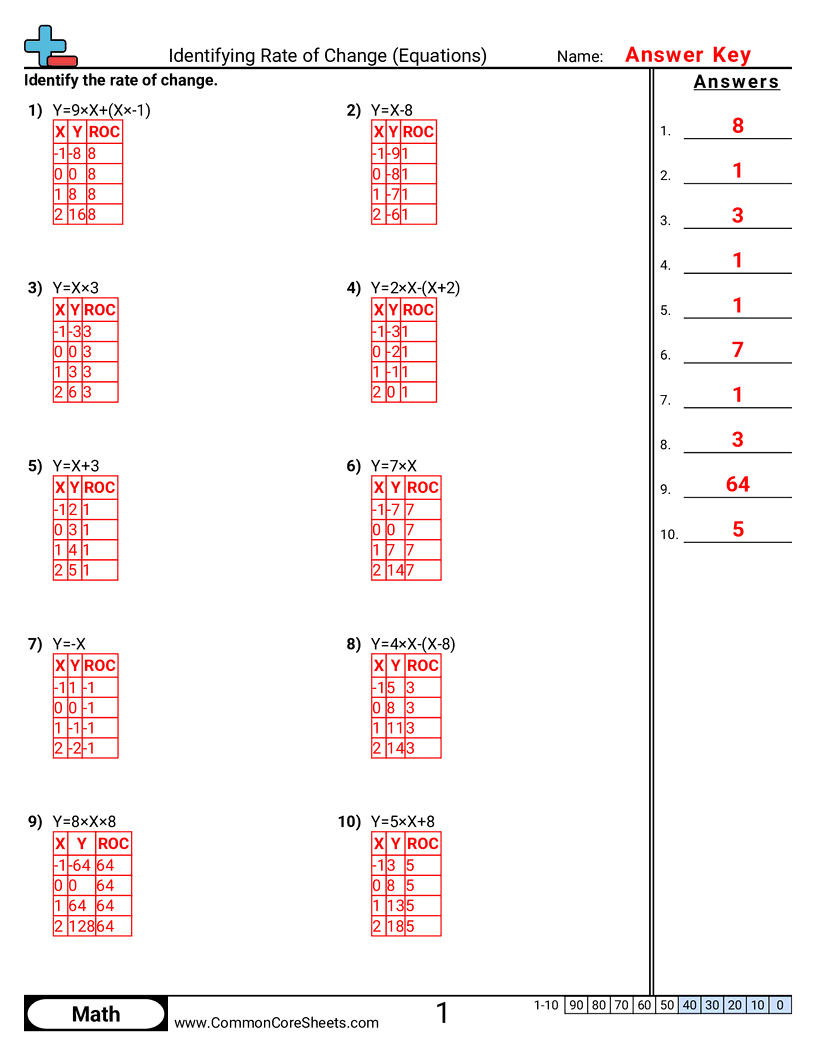
"This worksheet is designed to help children learn to identify rate of change in mathematical equations. With ten problem sets, each featuring unique equations, pupils will determine the rate of change for various functions. The worksheet can be tailored to individual learning needs, offering versatility for educators and students alike. Its format allows for easy conversion into flashcards or incorporation into distance learning platforms, offering an adaptable tool for mastering this essential mathematical concept."

×
Student Goals:
Understanding Fundamental Concepts of Mathematical EquationsUpon completion of this worksheet, students should have a solid grasp of the underlying principles of equations, specifically with a focus on identifying the rate of change. This acquisition of knowledge helps them to interpret and understand the relationships between variables in a mathematical equation, a crucial skill in the field of math.Building Problem-Solving SkillsThis worksheet is also designed to enhance students' problem-solving capabilities. They will learn to tackle complex math problems independently, developing a methodical, analytical approach. Handling each question in the worksheet reinforces their ability to apply learned concepts to solve problems, equipping them with the necessary tools to tackle more advanced mathematical problems in the future.Enhancing Mathematical ProficiencySolving these problems also helps students in enhancing their mathematical proficiency. The complexity and variety of problems make them familiar with different scenarios that could occur in math equations. This variety ensures they are adept at identifying and interpreting different types of rate changes, therefore becoming more proficient and confident in their math skills.Application of Real-World Mathematical ConceptsAnother accomplishment post completion of the worksheet includes understanding the application of the learnt mathematical concepts in real-world scenarios. Students will recognize that the principles of rate of change and understanding equations have extensive applications in numerous areas such as physics, engineering, finance, and more. This understanding enables them to translate classroom learning to real world situations.Critical Thinking DevelopmentLastly, these worksheets also aid in developing students' critical thinking abilities. By consistently practicing and solving these problems, students reinforce their logical reasoning skills. They will learn to form connections between steps, identify patterns, and deduce solutions, thereby encouraging a higher level of cognitive function.


8f2


×
Description:
"This worksheet is designed to help children understand the concept of 'Rate of Change' in graphs through six mathematical problems. It facilitates the learning of mathematical dependence and the identification of slope or rate from graphs. This versatile tool can be customized according to unique learning needs, effortlessly converted into flashcards for bite-sized learning, or utilized effectively in distance learning platforms to ensure comprehensive understanding, regardless of dispensation."

×
Student Goals:
Enhanced Mathematical SkillsAfter completing the worksheet, students should be able to demonstrate a significant enhancement in their basic mathematical skills. Particularly, they should be capable of comprehending complex mathematical concepts around the rate of change in graphs. This knowledge forms a crucial bedrock in understanding various other mathematics concepts including areas like algebra, calculus, and more. This understanding paves the way for students towards accomplishing proficiency in skills such as critical thinking and problem-solving.Mastering Graph InterpretationStudents will also build and refine their competence in interpreting and analyzing graphs. Their ability to identify and comprehend the rate of change in various types of graphs should noticeably increase. The aim is to enable the students to independently decipher and understand data sets presented in graph form, fostering a skill that is key in many future academic and professional pursuits.Practical Problem-SolvingWith this hands-on exercise, children should grow comfortable with applying their theoretical knowledge in practical situations. They should develop a strong foundation in understanding rate of change in graphical representations, preparing them for real-world applications. They should be able to identify patterns, trends, and relationships within data sets, which is also an essential skill for many disciplines like science and engineering.Building ConfidenceThis worksheet serves as a confidence builder, assisting students to overcome any intimidation they may feel towards math problems, especially those dealing with rates of change and graph interpretation. Through repetitive problem-solving, students should feel more confident in their math abilities and feel encouraged to tackle more complex problems or topics.Preparation for Advanced StudyCompleting this worksheet will aid in preparing students for more advanced study in mathematics. Understanding and interpreting rates of change from a graph are foundational skills that are used in higher-level math courses, such as Calculus. Therefore, achieving mastery in this area helps in laying down a strong groundwork for the upper-division math classes students will encounter in their academic career.


8f2


×
Description:
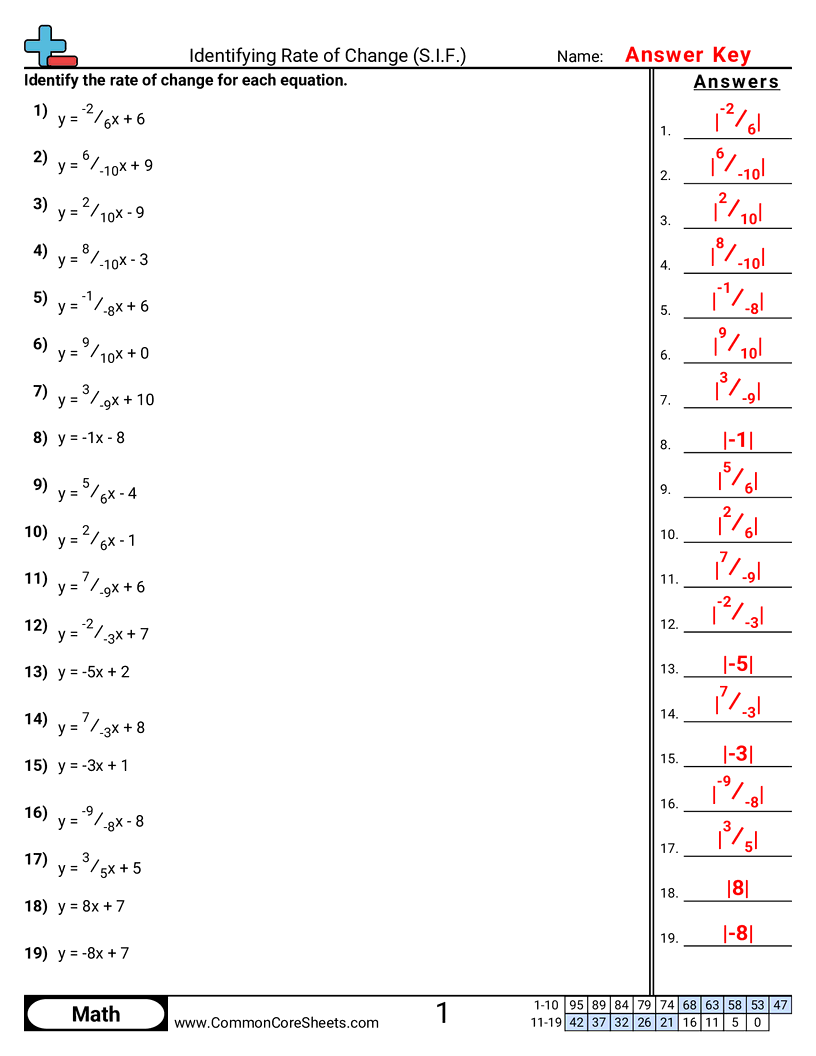
"This worksheet is designed to enhance children's ability to identify the rate of change in mathematical equations. With 19 diverse problems featuring different values of x and y, it provides a comprehensive practice for mastering this crucial concept in math. The worksheet is customizable and can be transformed into flash cards for an engrossing learning experience. Additionally, it's ideal for distance learning facilitating mathematical proficiency at any location."

×
Student Goals:
Understanding of Rate of ChangeUpon completing the worksheet, students should have a clearer understanding of the concept of rate of change in mathematical equations. They should be able to effectively identify and interpret the rate of change, getting a grasp of how it signifies the relationship between two quantities in mathematical functions.Solving Problems with Rate of ChangeThe worksheet gives students practice to accurately solve problems that apply the concept of rate of change. This promotes their abilities to scrutinize, analyze, and solve mathematical problems independently, boosting their problem-solving skills overall.Application in Real-life SituationsThe worksheet further prepares students to apply the concept of the rate of change in real-life situations. In economics, physics, and other fields, understanding how things change in relation to each other is crucial. Improving in this area will also enhance their critical thinking skills.Confidence in MathsBy addressing rate of change problems, students will also gain confidence in their mathematical abilities. Working through the different equations and finding the correct solutions will help to build students' confidence that can then be applied to other areas of mathematics.Preparedness for Advanced StudiesThe students would be adequately prepared for more advanced studies in mathematics. A solid understanding of rate of change and how to solve related problems will pave the way for more complex mathematical concepts and operations students will encounter as they progress in their mathematics education.


8f2


×
Description:
"This worksheet is designed to help children grasp the mathematical concept of identifying the rate of change from tables. Comprising of 12 engaging problems, it presents scenarios that allow learners to decode patterns and sequences. This versatile sheet can be customized according to different learning preferences, transformed into flashcards for more tactile learning, or utilized remotely for distance learning ensuring its compatibility with various teaching approaches."

×
Student Goals:
Understand the Concept of Rate of ChangeAfter completing the worksheet, students should be able to grasp the fundamental concept of rate of change. They should be able to articulate how rate of change is a measure of how one quantity changes in relation to another quantity.Apply Rate Of Change in Various SituationsStudents should become competent at applying the theory of rate of change in various practical circumstances. This involves interpreting tables to determine rates of change, finding patterns, and predicting future changes. This skill is instrumental in solving complex real-world problems.Develop Skills in Interpretation of TablesThis worksheet provides a plethora of table-based problems, so by finishing it, students will improve their skills in interpreting tables. They will become proficient at understanding the correlation between x and y variables, fostering data analysis skills that are transferable to other aspects of mathematics and beyond.Boost Problem Solving SkillsBy grappling with the worksheet's questions, students' problem-solving skills should substantially develop. They will improve their ability to understand, analyze, and solve a diverse range of math problems. This not only enhances their ability in tackling complex math notions but also complements their overall cognitive development.Increase Mathematical Vocabulary and CommunicationsWorking through the worksheet should enable students to expand their mathematical vocabulary. They should be able to understand and effectively communicate using terms such as 'table', 'coordinate pairs', and 'rate of change'. This will lead to more accurate descriptions and explanations in math-related discussions and assignments.Develop Critical Thinking SkillsHandling the various problems present in the worksheet will encourage students to develop their critical-thinking skills. They will need to employ logical reasoning to determine the respective rates of change and discern patterns in the tables. This development of critical thinking is a crucial educational accomplishment, with wide-reaching benefits across numerous academic domains.


8f2


×
Description:
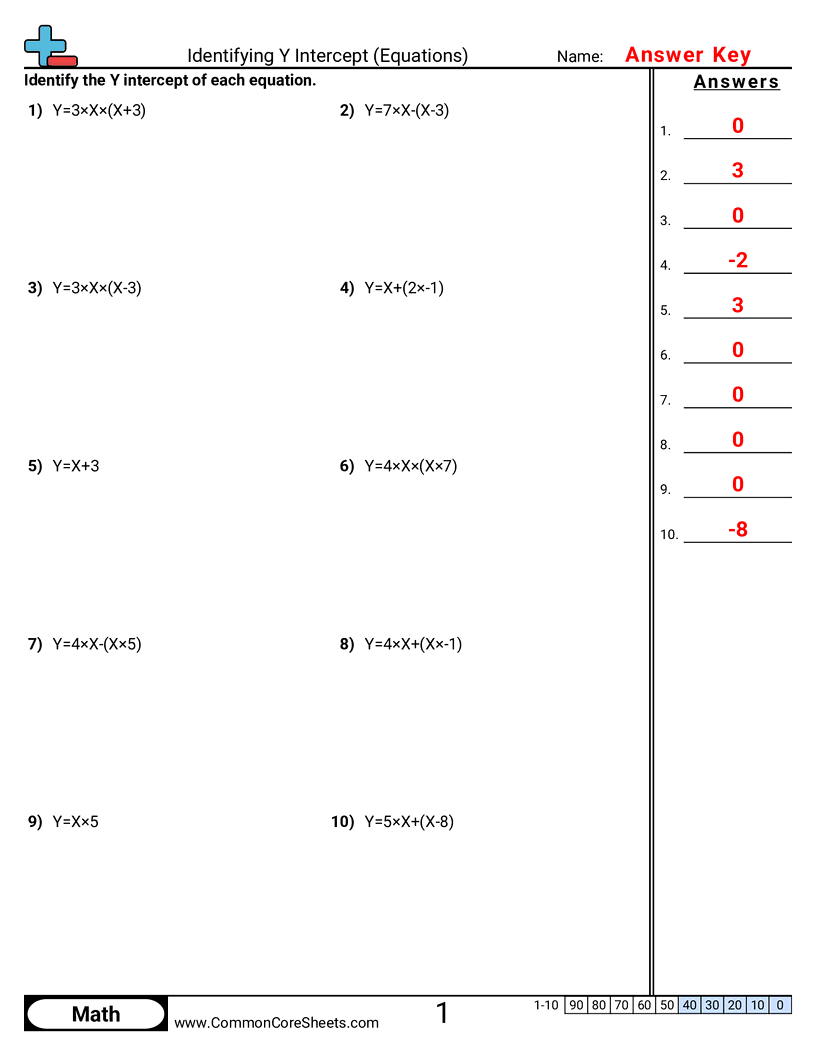
"This worksheet is designed to support young learners in understanding the concept of Y-intercept in equations. It includes 10 problems, with variances resulting from customizability that helps in enhancing understanding. It's easily convertible into flashcards and perfectly fits distance learning protocols. A perfect resource for strengthening your child's math skills, especially focusing on the relationship between equations and graphing."

×
Student Goals:
Understanding of Y-InterceptAfter completing the worksheet, students should be able to clearly understand y-intercept and its role in mathematical equations. They will become familiar with how changing parameters in linear equations changes the y-intercept. This will reinforce their understanding of the linearity of equations, and the relationship between coefficients and the y-intercept.Problem-Solving SkillsThis worksheet will help reinforce students' problem-solving abilities. They will have to approach each equation systematically, identifying the constant term that represents the y-intercept. This consistent practicing will boost their mathematical problem-solving capabilities, making them more capable of tackling similar problems in the future.Logical Thinking DevelopmentBy solving the problems in this worksheet, students will be exposed to several examples that will require them to utilize and strengthen their logical thinking skills. They will have to mentally separate the mathematical equation into parts, identify the y-intercept, and understand its significance. This exercise will help improve their critical thinking abilities, and contribute to their intellectual growth.Mastery of Linear EquationsAfter the successful completion of these problems, students should have a better grip on linear equations. They will get hands-on experience with different types of these equations, learning to identify the y-intercept in each. This improved understanding can contribute to a heightened comprehension of more complex mathematical concepts later on.Grasp of Mathematical RelationshipsThis worksheet will help students understand the relationship between variables and coefficients in the equation, and how they affect the y-intercept. They'll be able to visualize how changes to parts of the equation lead to changes in the graphed line, thereby deepening their understanding of the concept of mathematical relationships.Improved Mathematical VocabularyCompleting the worksheet will also broaden students' mathematical vocabulary. They will become comfortable using the term 'Y-Intercept' in the correct context, and this increased familiarity with the jargon of mathematics will assist them in their future mathematical studies.


8f2


×
Description:
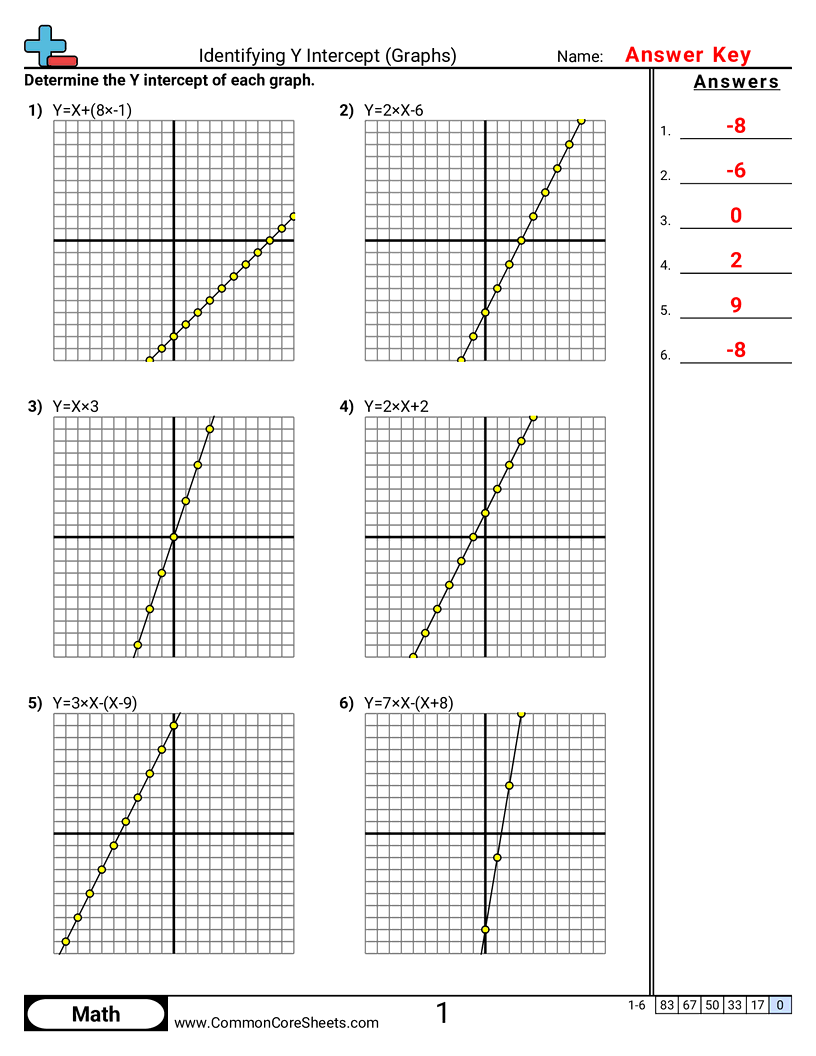
"This worksheet is designed to aid in the learning of a vital math concept: Identifying the Y Intercept in Graphs. With a variety of 6 problems ranging from simple to complex equations, like Y=6X+5 or Y=X-(5X-1), it's perfect for learners at different stages. The customizable worksheet can be converted into flashcards or integrated into distance learning for enhanced flexibility and convenience."

×
Student Goals:
Understanding y-interceptsAfter completing this math worksheet, students should have a firm grasp on the concept of y-intercepts in linear equations. This basic algebraic concept will allow learners to better interpret graphs, which is a key component of many future math lessons. By identifying the y-intercept, students are understanding how the graph of a function crosses the y-axis, a fundamental element in graphing lines.Problem-solving skillsAs students dissect these linear equations and identify the y-intercept, they are honing their problem-solving skills. This strategic approach to mathematics will not only aid in advanced studies, but it will also translate to critical thinking skills that can be used in everyday life. Growing their logical and methodical problem-solving skills through this worksheet will set them up for success in algebraic concepts and beyond.Preparation for more complex mathematical studiesCompleting this worksheet serves as a stepping stone towards more difficult mathematical concepts. Mastery of identifying the y-intercept gives students the confidence to tackle more complex aspects of algebra and calculus, setting solid foundations for lessons to come. It initiates a better understanding of the algebraic form of line equations, how they represent lines in Cartesian planes, and preps students for future studies in coordinate geometry.Mathematical language and notation fluencyThrough practice in this worksheet, students should strengthen their understanding of mathematical language and notation. Familiarity with mathematical expressions, particularly linear equations that contain variables and constants, is critical to progress further in mathematical studies. The experience gained from this worksheet will facilitate communication of mathematical ideas efficiently, making future exercises easier to comprehend.Spatial Awareness and Analytical ReasoningIdentifying the y-intercept is a stepping stone to developing spatial and analytical reasoning. Students will learn to visualize the graph mentally before drawing it, improving spatial awareness. Analytical reasoning skills are sharpened as they logically deduce the connection between the algebraic expression and its graphical representation, setting a strong foundation for future graphing and geometric tasks.


8f2


×
Description:
"This worksheet is designed to help children grasp the concept of identifying the Y Intercept in math. With 12 customizable problems, students can practice using different tables and equations to find the Y Intercept. The adaptable format allows the worksheet to be converted into flashcards or utilized for distance learning. It provides a versatile resource for improving children's understanding of this fundamental mathematical principle."

×
Student Goals:
Understanding Y InterceptAfter completing this worksheet, students will gain a thorough understanding of the concept of Y-intercepts in a mathematical equation. They will learn to identify the Y-intercept from different formats of linear equations by extracting it from tables and relating it to the equation itself. This will strengthen their ability to comprehend the basic structure of linear equations and how different elements, like the Y-intercept, interact within these equations.Problem SolvingUsing the problems provided in the worksheet, children will sharpen their problem-solving abilities. They will learn how to use structured, focused thinking to break down complex equations and graphs, identify patterns, and apply relevant mathematical rules to find solutions. With consistent practice, students will gradually become adept at solving similar problems with increased speed and accuracy.Application of Mathematical ConceptsThe exercise will help students in applying theoretical knowledge to practical algebraic problems. This will enhance their grasp of core mathematical concepts, improving their ability to apply these in different situations, inside and outside the classroom. In the process, students will also associate mathematical learning with real-life applications, making them more interested in the subject.Enhanced Computational SkillsChildren will be able to hone their computational skills as they solve problems based on the Y intercept. Regular practice of the problems in the worksheet will make them comfortable and proficient in handling numbers, thereby boosting their numerical skills.Preparation for Advanced LearningThis worksheet also prepares students for advanced learning by building a solid foundation in linear equations. It equips them with the necessary knowledge and skills for further study in algebra and other branches of mathematics. Mastery of basic concepts like the Y-intercept will ensure they find it easier to understand complex theorems and ideas in their future mathematical journey.Improved Confidence and Mathematical InterestSuccessfully identifying the Y-intercept and solving the problems will boost the students' confidence in their mathematical abilities. Consequently, it can foster a positive attitude towards mathematics, encouraging more curiosity and willingness to explore the subject further. An increased confidence level can also positively impact students' overall academic performance and create a favourable learning environment.


