
Flash Cards

Create New Sheet

Select a Worksheet >
Version 1
Version 2
Version 3
Version 4
Version 5
Version 6
Version 7
Version 8
Version 9
Version 10
Grab 'em All
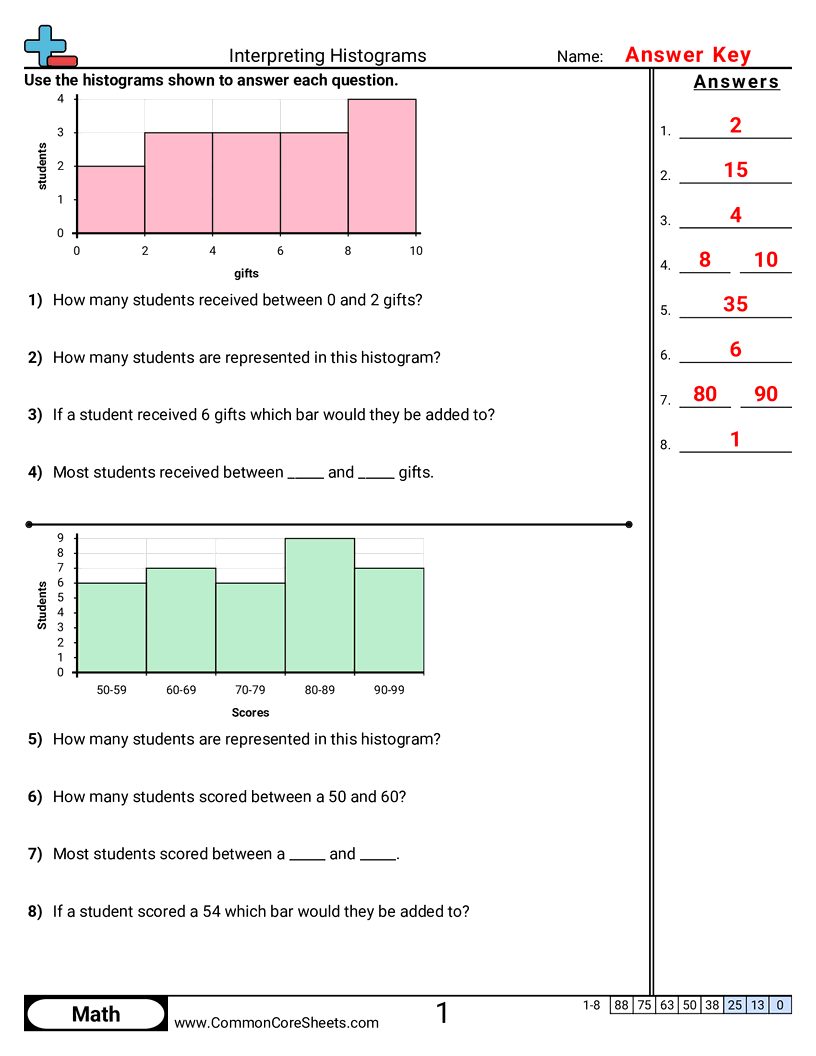
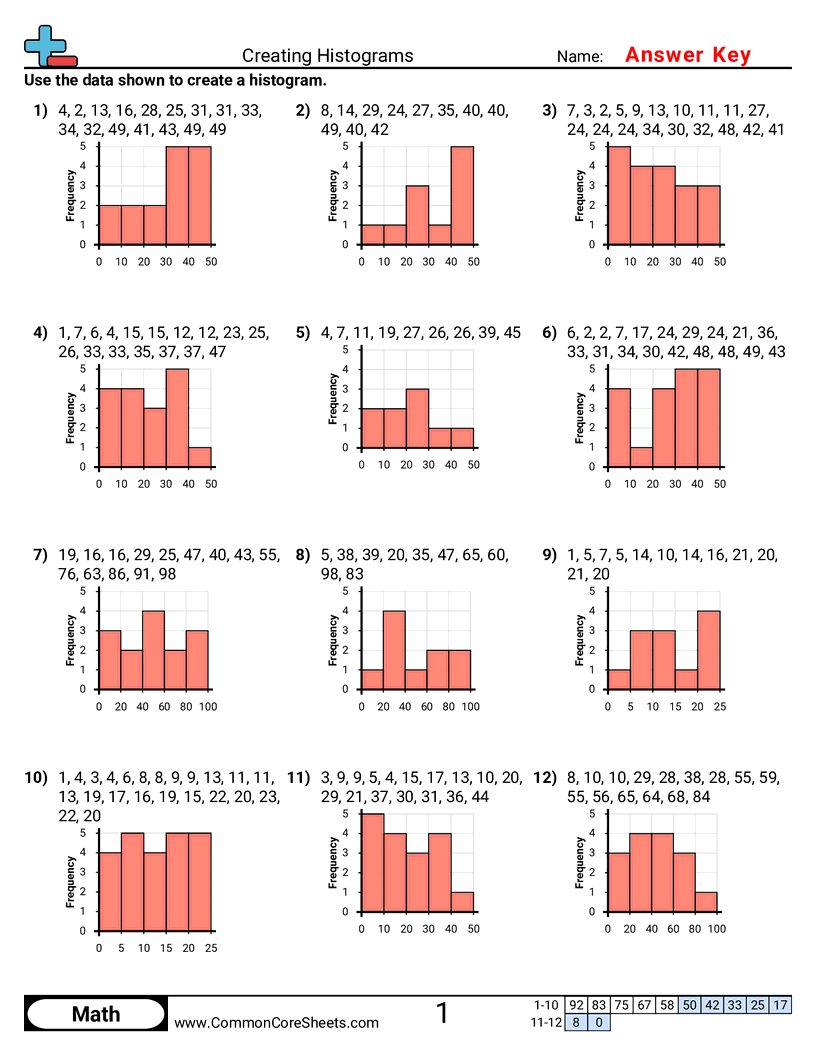
Creating Histograms


- Sort data into equal-sized intervals (bins) based on the number range.
- Count how many data points fall in each bin and record the frequencies.
- Draw a histogram with correctly spaced bars that match the bin counts.
- Read a histogram to describe which ranges happen most and least often.