Home
Favorites
My Account
Menu
Common Core Sheets
Math
Spelling
Create-A-Review
Create-A-Test
Create-A-Sheet
improving a paragraph
login
x
reading
>
Daily Reading Comprehension
New
comprehension - insects
comprehension - arachnids
comprehension - reptiles
comprehension - mammals
comprehension - birds
Teacher Panel
>
My Account
Distance Learning Assignments
My Classes
Grade Book
Grade Scale
My Created Sheets
Site Options
Spelling
>
Spelling Worksheets Maker
Spelling List Generator
New
User Spelling Lists
Math
>
Daily Reviews Creator
Create-A-Test
Create-A-Flash Card
Sort By Grade
Addition
Subtraction
Multiplication
Division
Algebra
Angles
Area & Perimeter
Balancing Equations
Bar Graphs
Box Plots
Capacity
Cheat Sheets
Converting Forms
Counting
Decimals
Division
Drills
Fact Families
Factors
Fractions
Grids
Lines
Line Graphs
Line Plots
Mean, Median, Mode & Range
Measurement
Money
Multiplication
Multistep Problems
Negative Numbers
Order of Operations
Patterns & Function Machines
Percent
Pictographs
Pie Graphs
Probability
Properties
Ratios
Rounding
Shapes
Statistics
Subtraction
Tally
Tape Diagrams
Temperature
Time
Trigonometry
Value & Place Value
Variables
Weight
Venn Diagrams
Volume
Drills
Search Premade Sheets
social studies
>
Geography
Primary & Secondary Sources
Timelines
Create-A-Sheet
science
>
Tools
Volume
Create-A-Sheet
Language Arts
>
Improving a Paragraph
Coloring Pages
>
Easter
New
Teacher Panel
>
My Account
Distance Learning Assignments
My Classes
Grade Book
Grade Scale
My Saved Sheets
Site Options
Languages
>
spanish
german
russian
italian
vietnamese
french
english
Help Support the Site
>
Patreon
Paypal
Other Stuff
>
How to Use Worksheets
Contact & Comment
Home
Math Worksheets
Bar Graph Worksheets
Interpreting Histograms
Like
Playwire Advertisement
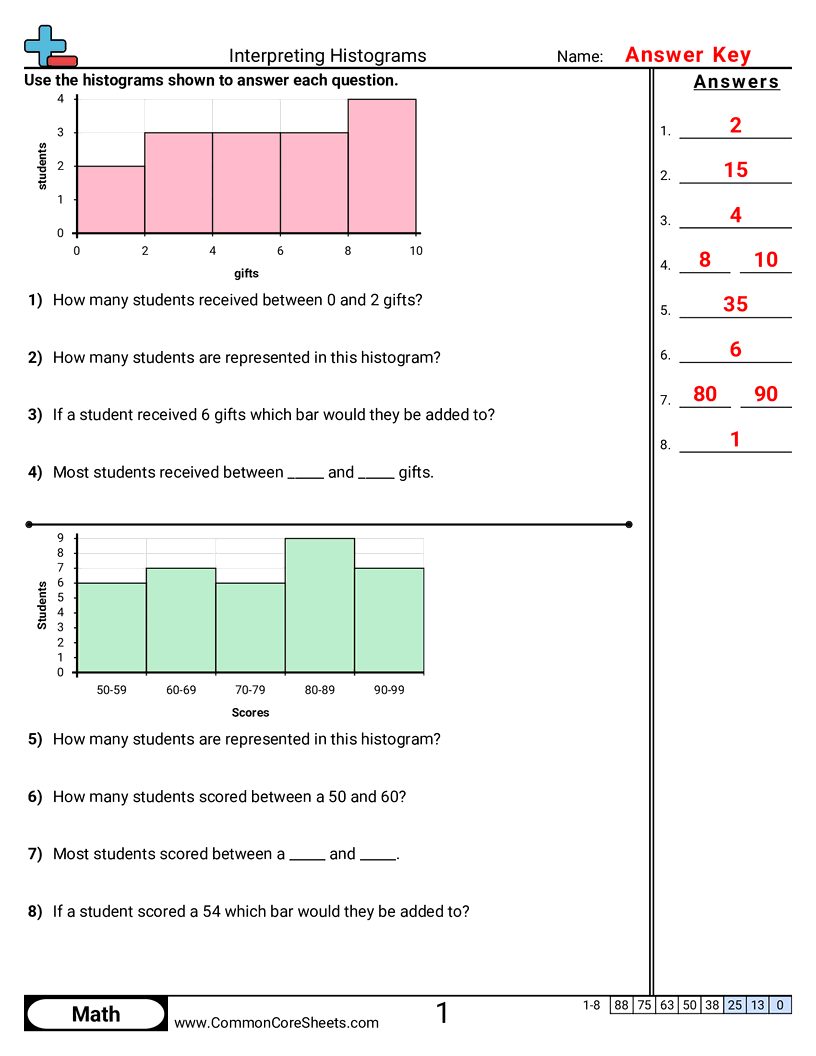
Interpreting Histograms
Each worksheet has 8 problems using a histogram to answer questions.
Worksheet
One Atta Time
Flash Cards
Distance Learning
Create New Sheet
Student Objectives
Read a histogram and explain what the bars and labels mean.
Find how many data points fall in a given interval (bin).
Identify which interval has the most or least data.
Compare two intervals to see where values are more common.
Tags
short sentence
visual
graphing
Standards
Playwire Advertisement