Reading a Bar Graph: 4 Bars - Single Unit Worksheet Download
Free 2nd Grade (2md10) math worksheets on Reading a Bar Graph . Each worksheet has 10 problems with an answer key and are ideal for teachers and homeschooling. You can download the PDF, create a set of flash cards or set it up for online learning.
Select a Different Activity
>


Sheet Information >
About this worksheet
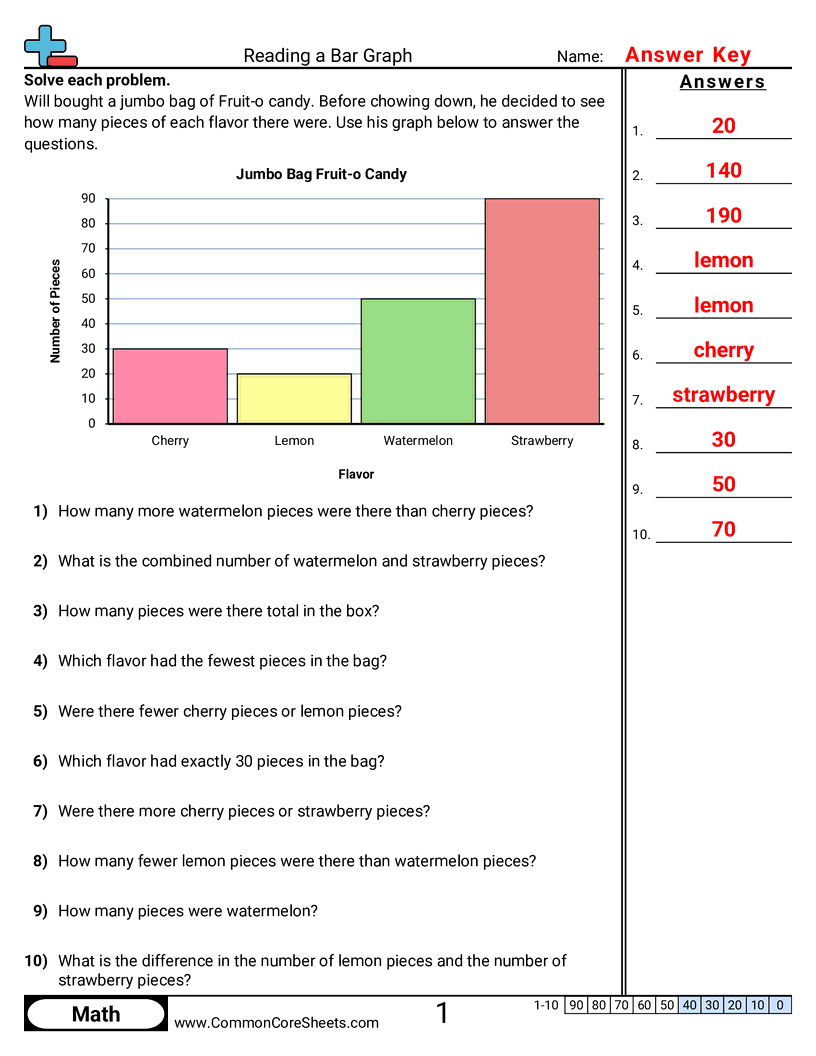
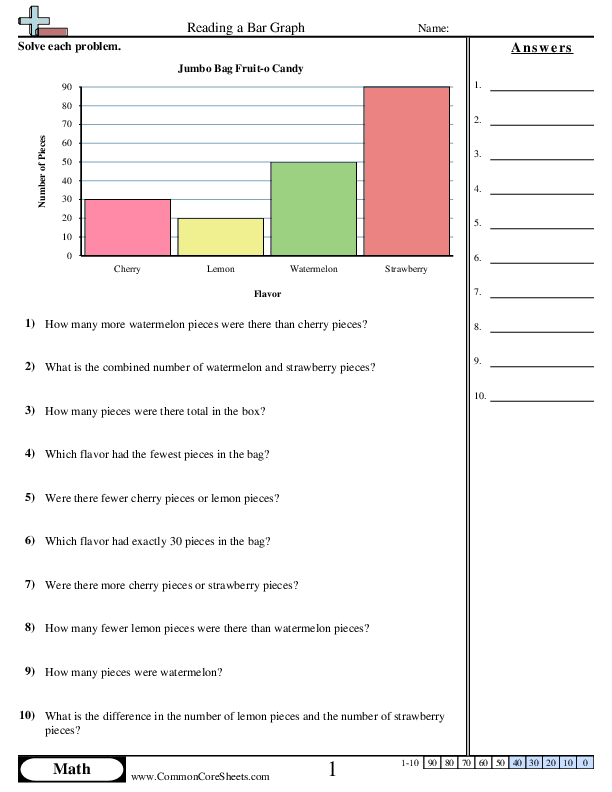
Each worksheet has 10 questions answering questions based on a bar graph.
This worksheet is designed to teach children the fundamentals of interpreting bar graphs in an engaging way. The focus is on reading graphs to understand and compare monetary savings data. With 10 problems, children can engage with real-world applications of math. The worksheet is flexible and can be customised to your child's needs, even converted into flashcards for convenient learning. It also serves as an excellent resource for distance learning, making math education accessible and fun.
Student objectives
- Read a bar graph with four categories and tell how many are in each bar.
- Answer “how many more” and “how many fewer” questions by comparing two bars.
- Find the total for all categories by adding the values from the bars.
- Identify which category has the most and which has the least.
Everyday practice
- Compare votes in a class poll chart to see which choice is most popular and by how much.
- Read a simple sports stats chart to compare how many points different players scored.
- Look at a weather chart to compare how many rainy days each month had.
- Check a reading log chart to see which day had the most pages read and the total for the week.